Tutorial: Debugging
For information on how to use experimental APIs, see the chrome.experimental.* APIs page.
Tutorial: Debugging
true
This tutorial introduces you to using
Google Chrome's built-in Developer Tools
to interactively debug an extension.
View extension information
To follow this tutorial, you need
the Hello World extension that was featured in
Getting Started.
In this section,
you'll load the extension
and take a look at its information
in the Extensions page.
-
Load the Hello World extension if it isn't already running.
If the extension is running,
you'll see the Hello World icon
 to the right of
your browser's address bar.
If the Hello World extension isn't already running,
find the extension files and load them.
If you don't have a handy copy of the files,
extract them from this
ZIP file.
See Getting Started if you need
instructions
for loading the extension.
-
Go to the Extensions page
(chrome://extensions),
and make sure the page is in Developer mode.
-
Look at the Hello World extension's information on that page.
You can see details such as the extension's
name, description, and ID.
As long as your browser is in Developer mode, it's easy to inspect popups.
-
Go to the Extensions page (chrome://extensions), and make sure Developer
mode is still enabled. The Extensions page doesn't need to be open
for the following to work. The browser remembers the setting,
even when the page isn't shown.
-
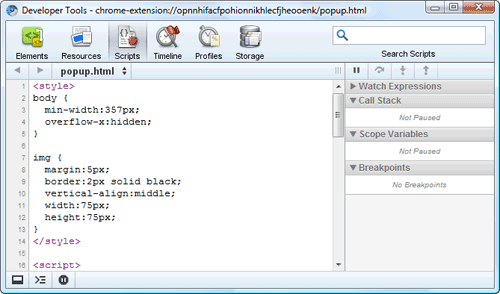
Right-click the Hello World icon
 and choose the Inspect popup menu item. The popup appears,
and a Developer Tools window like the following should display the code
for popup.html.

The popup remains open as long as the Developer Tools window does.
-
If the Scripts button isn't already selected,
click it.
-
Click the console button
 (second
from left,
at the bottom of the Developer Tools window)
so that you can see both the code and the console.
Use the debugger
In this section,
you'll follow the execution of the popup page
as it adds images to itself.
-
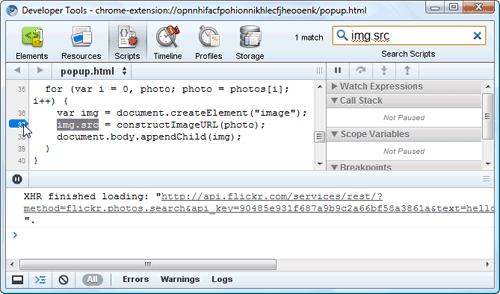
Set a breakpoint inside the image-adding loop
by searching for the string img.src
and clicking the number of the line where it occurs
(for example, 37):

-
Make sure you can see the popup.html tab.
It should show 20 "hello world" images.
-
At the console prompt, reload the popup page
by entering location.reload(true):
> location.reload(true)
The popup page goes blank as it begins to reload,
and its execution stops at line 37.
-
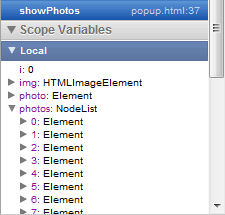
In the upper right part of the tools window,
you should see the local scope variables.
This section shows the current values of all variables in the current scope.
For example, in the following screenshot
the value of
i is 0, and
photos is a node list
that contains at least a few elements.
(In fact, it contains 20 elements at indexes 0 through 19,
each one representing a photo.)

-
Click the play/pause button
 (near
the top right of the Developer Tools window)
to go through the image-processing loop a single time.
Each time you click that button,
the value of
 i increments and
another icon appears in the popup page.
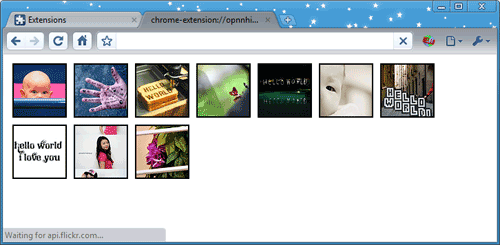
For example, when i is 10,
the popup page looks something like this:

-
Use the buttons next to the play/pause button
to step over, into, and out of function calls.
To let the page finish loading,
click line 37 to disable the breakpoint,
and then press play/pause
 to
continue execution.
Summary
This tutorial demonstrated some techniques you can use
to debug your extensions:
-
Find your extension's ID and links to its pages in
the Extensions page
(chrome://extensions).
-
View hard-to-reach pages
(and any other file in your extension) using
chrome-extension://extensionId/filename.
-
Use Developer Tools to inspect
and step through a page's JavaScript code.
-
Reload the currently inspected page from the console
using location.reload(true).
Now what?
Now that you've been introduced to debugging,
here are suggestions for what to do next:
-
Watch the extensions video
Developing and Debugging.
-
Try installing and inspecting other extensions,
such as the
samples.
-
Try using widely available debugging APIs such as
console.log() and console.error()
in your extension's JavaScript code.
Example: console.log("Hello, world!")
-
Follow the Developer Tools tutorial,
explore the
Developer Tools site,
and watch some video tutorials.
For more ideas,
see the Now what? section
of Getting Started.
API reference: chrome.apiname
Properties
getLastError
chrome.extensionlastError
Methods
method name
void
chrome.module.methodName(,
)
Undocumented.
A description from the json schema def of the function goes here.
Parameters
Returns
Callback function
The callback parameter should specify a function
that looks like this:
If you specify the callback parameter, it should
specify a function that looks like this:
function(Type param1, Type param2) {...};
This function was added in version .
If you require this function, the manifest key
minimum_chrome_version
can ensure that your extension won't be run in an earlier browser version.
Events
event name
chrome.bookmarksonEvent.addListener(function(Type param1, Type param2) {...});
Undocumented.
A description from the json schema def of the event goes here.
![]() to the right of
your browser's address bar.
to the right of
your browser's address bar.
